


Evidence shows that the US needs to catch up with China regarding technology. A list by Professor Allison of Harvard University in a book published by the Aspen Institute in 2020 shows seven sectors lagging. In January 2024, the Australian Strategic Policy Institute published a report detailing the lag in 9 sectors and 64 sub-sectors. In response, President Trump's administration placed tariffs on products of Chinese origin starting from March 2018. President Biden extended it and designed an import substitution policy to catch up with the leader. In the meantime, all Asian innovations threaten national security as they highlight its loss of leadership. The text will review the legal framework for ISI performance in the US over the past two years.
| Table 1 The key economic sectors in the competition between major powers Leadership by sub-sector |
|||
|---|---|---|---|
| Sectors |
United States |
China |
Number of sub-sectors |
| Advanced information and communication technologies |
1 |
6 |
7 |
| Advanced materials and manufacturing |
0 |
13 |
13 |
| Artificial intelligence technologies |
2 |
4 |
6 |
| Biotechnology, gene technology and vaccines |
3 |
4 |
7 |
| Defence, space, robotics and transport |
2 |
5 |
7 |
| Energy and environment |
0 |
8 |
8 |
| Quantum |
1 |
3 |
4 |
| Detection, synchronisation and navigation |
2 |
7 |
9 |
| Unique AUKUS technologies |
0 |
3 |
3 |
| Source: List of Critical and Emerging Technologies Updated: 22nd September 2023, Australian Strategic Policy Institute, ASPI's Critical Technology Tracker - Sensors & Biotech updates |
|||
The real problem that the US is facing is not just technological backwardness
The US economy presents a paradox. It carries the highest level of debt and one of the most substantial fiscal deficits relative to GDP globally. However, it operates within a slow-growth economy, where public spending does not drive growth. This is partly due to the fact that public expenditure is not effectively coupled with private-sector investment. Another contributing factor is the significant share of the budget that goes towards servicing the debt, resulting in actual public spending being several percentage points less of GDP than it appears.
Education and backwardness
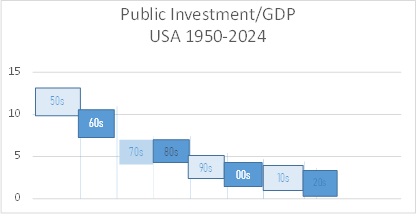
With an interest rate of around 5% for federal funds instruments over the last four years and a debt-to-GDP ratio of 122%, debt service takes 6.1% of GDP. In other words, the fiscal deficit barely covers the cost of the debt. To maintain it, they had to curb the rate of public investment and public spending, with a negative effect on the economy as a whole. From an average of 13.5% of GDP in the 1950s, public investment fell to 7.4% in the 1970s and 1980s and continued its decline in the 1990s and the first decades of the 21st century, where the average for the third decade of the century is just 3.7% of GDP, almost half of what they spend on interest on public debt and a quarter of what they spent in the 1950s.
The dysfunction of public investment can be perceived in the deterioration of the national infrastructure and the backwardness of educational and public health infrastructure, which were exemplary in the 1950s. Educational backwardness is another part of the decline in educational infrastructure investment. The PISA 2022 test reflects that the US average in mathematical literacy was below the average of 21 education systems, above the average of 6 and not significantly different from the average of 9. The US average in reading literacy was above the average of 28 education systems, below the average of 3 and not significantly different from the average of 5. Finally, science literacy was above the average of 16 education systems, below the average of 5 and similar to the average of 15.
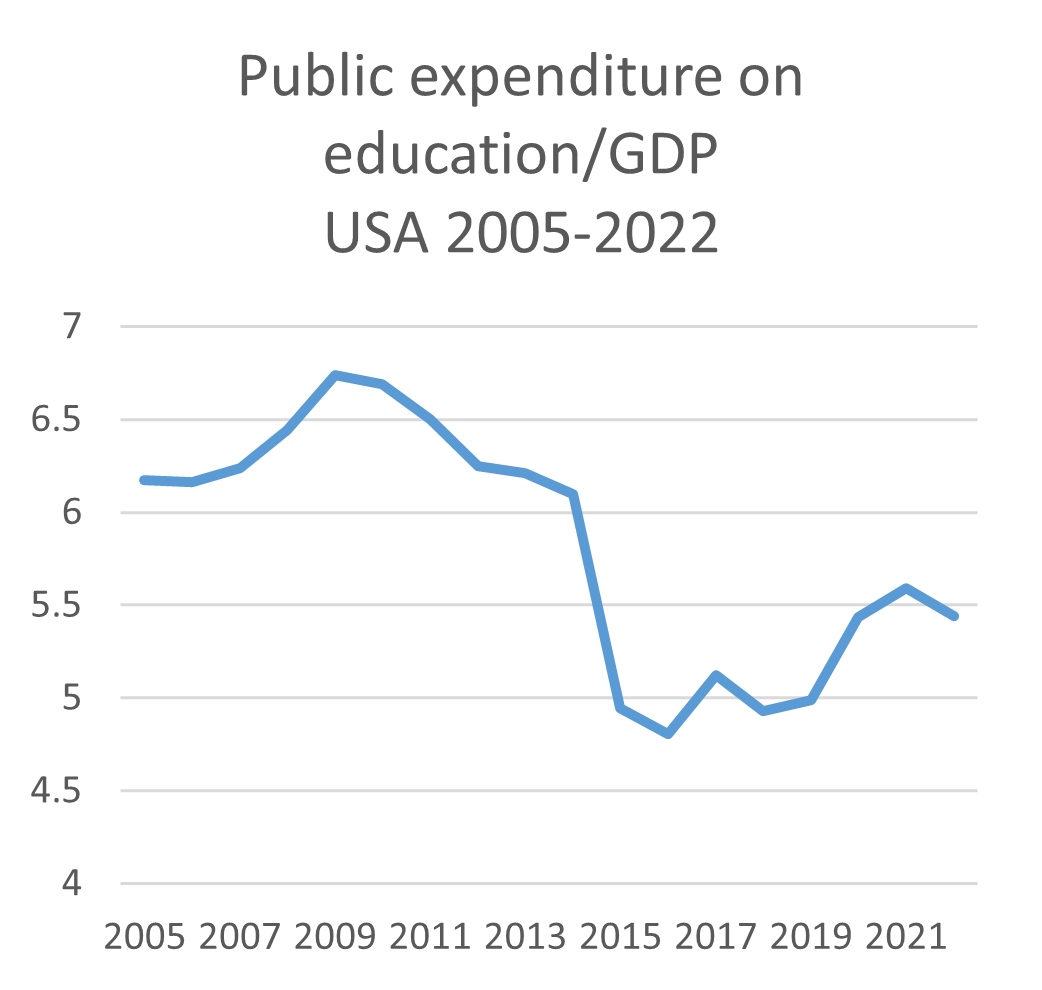
The impact of this on the ability to catch up with the education systems of the countries that have star students in all fields, which are Singapore, Macau (China), Taiwan, Hong Kong (China), Japan and the Republic of Korea is relevant because the ISI policies they have put in place aimed at catching the US up with China in the fields where it is lagging (see table). Public current spending on education has been cut by a third from almost 7% of GDP to less than 5% and then stabilised at 5.4% of GDP, less than the budget uses to cover its interest payments on public debt.
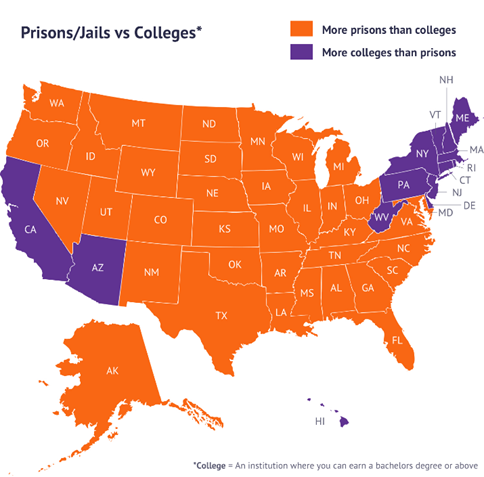
One effect of the decline in education is that there are more prisons than universities in the US. Cutting current funding to education along with privatisation of the prison system has led to the reality that there are more prisons and that there is also a public health problem with adolescent drug abuse. According to the National Survey Results on Drug Use, 1975-2023: Secondary School Students, the lifetime prevalence levels of drug use in 2023 were 22% for 8th graders (first year of secondary school), 29% for 10th graders (third year of secondary school or first year of high school in Mexico) and 42% for 12th graders (fifth year of secondary school or third year of high school in Mexico) with the effects of this on motivation and learning. After 2024, the question is whether it will be possible to recover public spending on education and infrastructure with such a high and unproductive level of debt. Similarly, the problem of drugs among adolescents, which is not only a problem of supply but also demand, must be addressed.
Military spending and growth
Military spending leads to all public expenditure, and its multipliers do not operate as expected. Military industry linkages are outward to the economy and explain a substantial part of the external deficit, which is around 3% of GDP but which, until 1980, was in the neighbourhood of 0. Military spending, which is 13% of the programmed 2024 budget, is equivalent to 3.4% of GDP according to SIPRI and is equal to health spending. The question is whether the wage share grew much in the budget and what the consumption pattern looks like, given that Government infrastructure investment shrunk. The size of the external deficit reflects very significant imported consumption while, on the other side, they do not export enough. The projections support these trends.
| Public Expenditure 2024 By category % |
|
|---|---|
| Category |
% |
| Social Security |
21% |
| Medicare |
14% |
| Net interest |
13% |
| Health |
13% |
| National Defence |
13% |
| Income Security |
11% |
| Veterans' benefits and services |
5% |
| Education, training and employment |
3% |
| Transport |
2% |
| Community and regional development |
2% |
| Other |
4% |
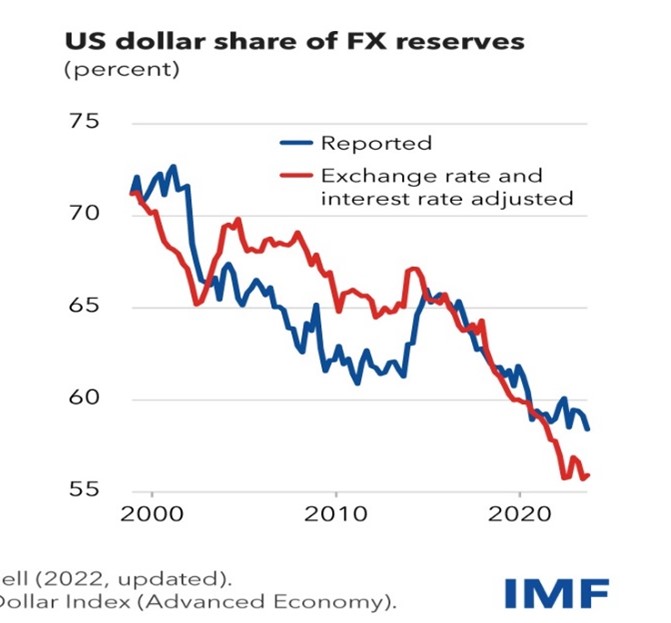
China, Japan, and developing economies have historically financed the deficit since 1980, but China has always been the leader. In recent years, it has reduced its treasury bond position by holding more gold reserves and other currencies of non-conflict trading partners. Overall, international reserve positions in dollars are declining, and by 2024, they will reach 55% of world reserves, down sharply from over 80% in the decades before 1980 (IMF 1980 Report, table 16).
The ISI and the new laws
In 2021, US Congress passed a law to strengthen the country's infrastructure called the Bipartisan Infrastructure Act.
It acknowledges a lag in electromobility issues and announces investments in electric chargers. The Journal of Consumer Affairs evidence is that the installation of electric vehicle (EV) charging stations grew steadily at a compound annual growth rate (CAGR) of 43.7% between 2018 and 2023. The number of stations increased from 22,826 to 64,187 nationwide, 46% concentrated in five states. That leaves 46 states out of the race in the energy matrix change.
The same law says that the most significant investment in passenger rail since the creation of Amtrak will be made, with 66 billion dollars earmarked for improving the rail system and placing it at the heart of the country's transport and economy. The new trains are diesel-powered (https://media.amtrak.com/2020/08/amtrak-prepares-for-new-diesel-locomoti... ) with a top speed of 250kmph and an average of 207kmph versus the Chinese electric trains, which go 350km per hour, the Japanese electric bullet which goes 320kmph; the Spanish electric AVE, which goes 310kmph, and the French TGV, which goes 300kmph. In other words, diesel locomotives have a limited and lagging renewal process relative to the state-of-the-art technology five or six decades ago. The Chinese CR450 train has reached a top speed of 453 km/h on a daily route. In other words, US energy and transport modernisation has become trapped by the fossil fuels energy industry and the private sector's unwillingness to substitute mass road, air freight and passenger transport.
The bill includes resources to modernise airports and ports to strengthen supply chains to avoid disruptions. It incorporates modernising electricity infrastructure to deliver clean, reliable energy nationwide and deploying cutting-edge energy technology to achieve a zero-emissions future. According to the EPA, in 2019, natural gas had the largest share (38 per cent) of US electricity generation, coal had the second largest share (23 per cent), and nuclear had the third largest share (20 per cent). Renewable energy sources contribute about 17% of US electricity production at utility-scale facilities. Coal-fired power plants were to retire by 2023 and gas-fired by 2030.
New renewable energy capacity, mainly wind and solar, will replace electricity from coal and natural gas plants in 2023 and 2024.
In 2022, wind and solar accounted for 14% of electricity generation in the US, expecting to increase to 16% in 2023 and 18% in 2024. Coal-fired electricity generation will decrease from 20% in 2022 to 17% in 2023 and 2024. Natural gas, which accounted for 39% of generation in 2022, will remain similar in 2023 and fall to 37% in 2024. Electricity from renewable sources has grown steadily over the last decade, accounting for almost a quarter of total generation in 2022. In other words, the law pushes the switch to renewables. Renewable technology is of Chinese origin, and this law attempts to have the US compete with inputs.
The bill aims to build infrastructure that is resilient to the effects of climate change, cyber-attacks and extreme weather events. In environmental terms, it will be the most significant investment in US history in fighting legacy pollution through the EPA's Superfund programme that cleans up the country's most contaminated land and responds to environmental emergencies, oil spills and natural disasters, as well as cleaning up and reclaiming brownfields and abandoned mines, and decommissioning oil and gas wells.
The following year (2022), Biden enacted the Chips and Science Act as an industrial policy to manufacture integrated circuits and not buy them from China. The Inflation Reduction Act in 2023 followed, which enhanced or created more than 20 tax incentives for clean energy generation and manufacturing. These include bonuses to encourage community investment and increase private sector investment. For the first time, it opens access to tax incentives for clean energy use to tax-exempt entities such as state, local and tribal governments, rural electric cooperatives, and others. It also established requirements for incentives to strengthen supply chains for materials and equipment.
Stiglitz argues that, in the longer term, the picture is more stark and grim. America's economic success in recent years is mainly due to its technological capacity, underpinned by solid scientific foundations. However, he believes that Trump will continue to attack universities and demand deep research and development cuts if elected.
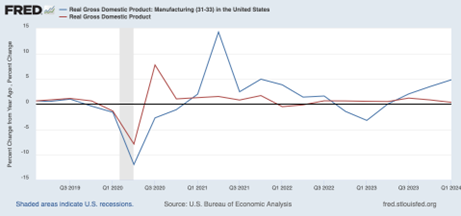
The effect of the above is that the US economy has been pulled by industrial sector growth since 2021 in a new impulse analogous to the one in Latin America in the much-criticised period of import substitution. After all, it seems that the ISI does work, and the discussion on industrialisation can start again with the prior knowledge that it leads to inflation rates above 2% but that it is irrelevant if it generates welfare for the population as a whole and stability in the economic dynamics. The US's technological and educational lag behind the Asian leaders cannot be remedied in the short term through US public policy. Although the ISI is a step forward, the speed of innovation will allow it to leap. It will be at the heart of the electoral economic debate.
References
The Surgeon General's New Mission: Adolescent Mental Health - The World Business News. https://theworldbusinessnews.com/the-surgeon-generals-new-mission-adoles...
Reneau, J. (1997). The General Well-Being of Recreational Drug Users: A Sub-Analysis of the Drugnet Survey. https://core.ac.uk/download/43617860.pdf
De Carne, G., Zou, Z., Buticchi, G., Liserre, M., & Vournas, C. (2017). Overload Control in Smart Transformer-Fed Grid. https://doi.org/10.3390/app7020208
Antigua and Barbuda tops the spot for travel and tourism investment - Antigua and Barbuda News !. https://antigua.news/antigua-and-barbuda-tops-the-spot-for-travel-and-to...
(2023). United States : Biden-Harris Administration Announces Billions in Passenger Rail Projects Across the Nation. MENA Report, (), .
Superfund – Newtown Creek Alliance. https://www.newtowncreekalliance.org/superfund/
Inflation Reduction Act | U.S. Department of the
Treasury. https://home.treasury.gov/policy-issues/inflation-reduction-act
The Surgeon General's New Mission: Adolescent Mental Health - The World Business News. https://theworldbusinessnews.com/the-surgeon-generals-new-mission-adoles...


